Data Analysis
Madrid Airbnb Data Analysis
End-to-end product design and front-end for a consumer banking experience focused on trust, speed, and clarity.

Excel · SQL · PowerBI

Summary
Fred is a short-term rental property investor, looking to expand his international Airbnb listings into Spain, specifically his favorite city, Madrid.
He has asked that I provide insight into what the Airbnb market looks like, in terms of pricing, listing type, minimum nights, what the most popular neighborhoods are, or even what districts could we investigate.
Average Pricing
Listing Types
Minimum Nights
Popular Neighborhoods
Popular Districts
How to get started:
Collect Data
First things first, we need to find reputable recent data about Airbnbs in Madrid. For this, I found Inside Airbnb, a mission driven project that provides data and advocacy about Airbnb's impact on residential communities.
I would recommend checking out their explore page to see how expansive Airbnbs are around the world.
For this project though, we are selecting data from Insideairbnb.com under Madrid, Comunidad de Madrid, Spain for the latest data of the time: June 20, 2026.
Cleaning Data
Next, we look over the data in MySQL to check the data formats and see if there is any unnecessary things. Once we have determined changes that need to be made, we create a staging table so we do not alter to the main data directly.
IMPORTANT: Create staging table before applying the following changes.
Check for duplicate rows
Drop empty or unnecessary columns
license column
host_name column
host_id
host_profile_id
Ensure listings are pointing to correct neighborhood and district names
Deleted all rows that do not have a price
Reformatted dates
Changed data format of reviews_per_month and price
Analyzing Data
After we have cleaned the data and have a properly organized staging data set, we can then begin our analysis. This is also conducted in SQL in a separate script for organization.
To really get down into the grittiness of the data, I pass through two waves of analysis. The first wave is my exploration phase, where I am understanding the data and what we might find along the way.
I would ask myself questions and set general goals:
I want to see what neighborhoods make the most money.
I want to see if availability shows anything about the cost or neighborhood
What types of listings have less availability?
What are the most popular room_types?
What can we find about reviews?
From here, we start to form more concise questions that narrow our focus on potential insights. After the first wave is satisfactory, we move on to a second phase of analysis. To do this, I copied my initial analysis and cleaned up the script to be more straightforward, and further documented: Airbnb Madrid - Analysis2.sql
At the top of my new script, I put a main objective for what I’d like to have at the end of my analysis:
“-- I'd like to see several bins showing the average availabilities compared to how much those availabilities make.”
Following this, is my concise list of questions I want to answer:
Though these are much the same questions as the initial phase, sections have been labeled and numbered throughout the MySQL script, where I would be able to display and scan the data with the intent of answering each one.
This is an important step because now we are also removing arbitrary explorative queries and ensuring that only the essentials are present for achieving our main objective. Additionally, we can take shorthand note of insights we are finding along the way to each of our questions.
One thing we will find is the issue of dealing with discrepancies or outliers that may skew our dataset. One in particular was an Airbnb, categorized as an entire house/apartment which had a ridiculously high price that would overshadow much of our view on pricing in Madrid.
This was particular important to acknowledge when answering “4. Which bnbs are booked more, lower priced or higher priced neighborhoods?” I created an extensive CTE to help address this issue
Let’s break this down into what it really is. After first, it looks like a massive cluster, but the end result is quite minimal but useful. Here, we are creating four main CTEs.
Average_cte
variables_cte
Max_average_cte
Min_average_cte
This will help us to eventually create a table with Four cells, displaying:

Essentially, what this stacked CTE is doing, is funnelling all the data down into a callable query, in which we can request for:
Average High Price
Total High Bookings
Average Low Price
Total Low Bookings
This is done so we can identify which pricing range potentially leads to the most bookings. If Fred were to look for a property for an Airbnb, where would people want to stay? Are guests staying in high-priced, higher quality bookings, or are most booking a smaller, less private space for convenience of travel?
We we looking to see if there was any larger sway in bookings. Clearly, low bookings is more, but not by a significant jump. However, it does answer our initial question.
To break down the stacked CTEs, I would explain them as so:
Average_cte
We first query to see the general average price per neighborhood and how many bookings are in each neighborhood.
variables_cte
We then define the Average price, the Max price, the Min price, and the total neighborhoods
Next, we create two similar queries to compare the overall average
Max_average_cte
We find the list of neighborhoods where the average price is great than the overall average.
Min_average_cte
We then find the list of neighborhoods where the average price is less than the overall average.
This way, we are then able to query everything to look at the difference between the average of all the higher priced listings and the average of the lower priced listings, and each bins’ respective total number of bookings.
Results - PowerBI Dashboard
After I am satisfied with my final analysis, I then export the essential queries as CSV files which I check in Excel for consistency, before importing them into PowerBI.
Make sure to include the clean dataset as well to serve as the parent table to connect everything in Model View.
Here, we are able to display the final results to Fred, our international Airbnb investor.

Starting from the top, we can see the outcome of our hefty CTE query from before. Easily, lower priced listings have the potential to accumulate far larger amounts of income in Madrid than higher priced, despite being less than half of the average higher priced listings.

From the top right segment, we can see that most listings fall within the category of Private room and with the default minimum bookings of one night.
We could then assume that most lower-priced bookings are typically private rooms rather than entire homes or apartments like you might find in the US.
Additionally, when clicking on the rows below 1 minimum_nights table, we find the pie chart on the right updating to reveal that most listings that require more than 1 night of listing, are typically entire home/apt.
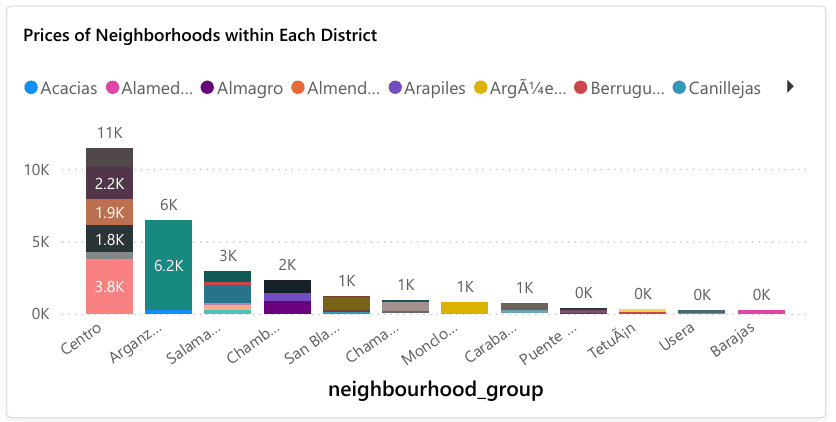
From this bar chart, we can see that the district, Centro, has the most Airbnb listings, totalling over 11,000 in pricing. This is, by name, the center of Madrid, and has the most activity, being accessible to some of the most famous sights of Madrid.
When looking at the map, we can see most listings in Centro being in Cortes neighborhood.
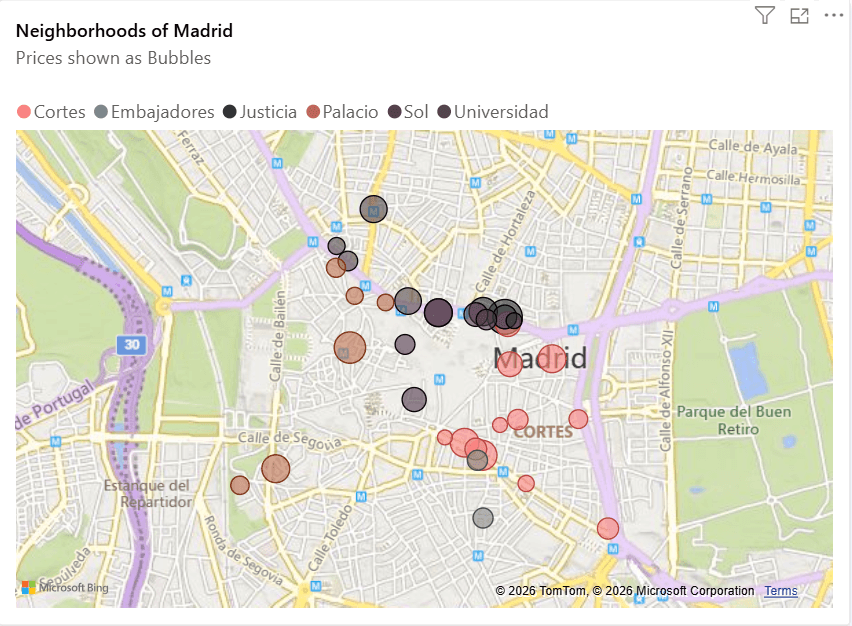
Perhaps if we wanted to take another look at Entire home/apt listings. here might be the results after clicking on this category in the “Room Type Comparison” pie chart:


Not only does this reconfirm how there are very few of this room type in Madrid, but interestingly, Arganzuela district is primarily made up of these listings. And when we click on this district:
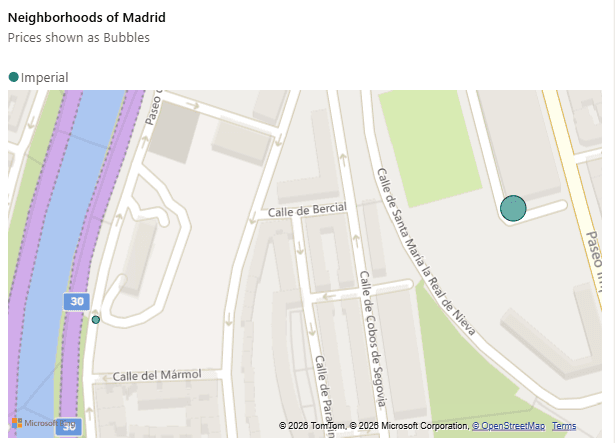
We will only find two entire home/apt listings, being in the Imperial neighborhood in the Arganzuela district.
Based on some of the results we see, I would recommend to Fred, that he looks for properties either within Centro, where most of the competition is in, or within Salamanca which has far less competition and is fairly close to Centro.
I would also advise Fred to consider looking at properties with multiple bedrooms as to rent out more private rooms with the opportunity to have a higher rate of bookings in the area with just the minimum of 1 night.
If Fred were to choose the Salamanca district for the lower competition, I would point his attention to the three lower neighborhood listings closest to Centro:

Left to right: Recoletos, Recoletos, and Goya.
Recoletos would be a good neighborhood to look for properties, especially since it is also around 4 blocks away from Parque de Buen Retiro, a famous park for guests to explore close to the center of the city.
Name | Detail |
|---|---|
Neighborhood | Recoletos |
Neighorhood District | Salamanca |
Minimum Nights | 1 |
Room Type | Private Room |
Average Pice | Between $118-$160 (Based on prices in this area, and the total average). |
Final Statements
I was very happy with how this project came out. I was hoping to utilize more data than what I had at the end of my cleaning stage, however, a number of listings were missing crucial data, and some datasets, like calendar and reviews, were not accessible. Nor was there any present data showing actual listings for me to determine more accurately what Airbnbs were receiving bookings.
Additionally, as an initial step I hoped to take for exploring this project, was the possibility of looking at recent data from Idealista, a European property listing website, best used for Spanish homes and apartments. However, their data is only accessible with written permission to scrape their website, or paid commercial use for their API.
I was able to find older listings online of properties in Madrid, but they were not confirmed to be from a reputable source, nor were they recent. So, I chose to focus solely on data that comes from Inside Airbnb instead.
Another thing I did not anticipate, was the difficulty of presenting the PowerBI dashboard. I was unable, currently, to Publish or share the PowerBI project in a live format. As of this time, I can only share the file or a PDF, so this reduced everything to image references and descriptions.
If you would like to see the file yourself, please visit the Github repo here.
Moving forward, I would probably look towards other means of displaying this data so that others can interact and explore insights. Front-End libraries like Chart.js and more could be useful in this case, and may expand this project into a cloud-hosted webpage with an organized report.
Thank you for reading my findings, I would be happy to share any deeper technical insights or answer any questions you may have.
Please feel free to reach out to me either on LinkedIn or by submitting a contact form here.